- 20 January 2025
- Latest news
- Data
- Industrie
- Products
Category: Products
Blog
- 27 August 2024
- Latest news
- Data
- Products
The ECO-SCORE® method is updated to provide ever more accurate information on the environmental impact of food.
Five amazing products you can find with us
- 16 May 2023
- Products
Animal Proteins: Tips for More Sustainable Consumption
- 14 March 2023
- Latest news
- Products
How to choose your fish and seafood consumption?
- 22 November 2022
- Latest news
- Labels
- Products
Eat sustainably in 8 key steps
- 11 November 2022
- Latest news
- Labels
- Products
Retail: ECO-SCORE® by Beelong comes to Coop

Download our brochure
To obtain our brochure, simply complete the form below and we will send it to you by email 🙂

Download our brochure
To obtain our brochure, simply complete the form below and we will send it to you by email 🙂

Download our brochure
To obtain our brochure, simply complete the form below and we will send it to you by email 🙂

Download the methodology
Would you like to receive the detailed methodology of the Beelong eco-score? Just fill in the form below and you will receive it by email 🙂

Energy intake
ECO-SCORE® by Beelong relates the environmental impact of food products to their energy (kcal) rather than their weight (kg). Indeed, the environmental impact of a food product, in particular its carbon footprint, is most often tied to its weight. However, this does not allow for a clear comparison of foods based on their primary function: feeding the population. relates the environmental impact of food products to their energy (kcal) rather than their weight (kg). Indeed, the environmental impact of a food product, in particular its carbon footprint, is most often tied to its weight. However, this does not allow for a clear comparison of foods based on their primary function: feeding the population.
Une approche par kilocalories permet de :
- Make relevant comparisons between different product categories
- Align our recommendations with the Food and Agriculture Organization of the United Nations (FAO) definition of food security
ECO-SCORE® by Beelong is intended to guide the consumption of food products, the recommendations should enable the consumer to eat in an eco-responsible way whilst still eating enough. However, not all foods have the same energy content. In the food industry, the energy intake and the energy needed by the body to maintain its functions is always expressed in “calories”, and measured in kilocalories (kcal).
An eco-friendly diet should go hand in hand with meeting one’s energy needs. Although energy needs do depend on age, gender, activity and physical condition, on average everyone needs approximately 2,000 kcal/day (OBSAN, 2020). Thus, for the world’s population to eat sustainably without going hungry, these 2,000 kcal/day should be as eco-friendly as possible. In other words, ECO-SCORE® by Beelong encourages the consumption of as many “eco-friendly calories” as possible.
For instance, if we replace 100 g of chicken (163 kcal) with 100 g of tomatoes (21 kcal), we would have to eat 8 times more tomatoes, i.e. 800 g, to achieve the same energy intake. This would multiply by 8 the environmental impact of tomatoes, compared to their energy intake.
Weighting the environmental impact of a product by its energy intake instead of its weight can thus reduce certain biases when comparing products from different categories. Therefore, ECO-SCORE® by Beelong makes it possible to tie environmental performance to food security and sufficiency.
Expressing the environmental impact of food per unit of weight (kg) or per unit of energy intake (kcal) has an influence on the order of magnitude of the various product categories. For instance, the environmental impact of high-calorie products (cereals, nuts, oils, butter, etc.) ends up being slightly corrected compared to the environmental impact of low-calorie products (salad, tomatoes, cucumber, etc.).

Product composition
The environmental impact of a food product is closely tied to its composition, i.e. the list of ingredients (declaration) and their quantity (%) contained in the finished product.
This is why each ingredient is first assessed based on a series of criteria relating to CO2 emissions, water and land use, biodiversity, endangered species, animal welfare, etc. Other criteria are then applied to assess the finished product itself, such as the impact of its packaging and the processing company’s sustainability policy.
Two seemingly indistinguishable products can thus receive very different Scores, due to their different composition.
Distances travelled
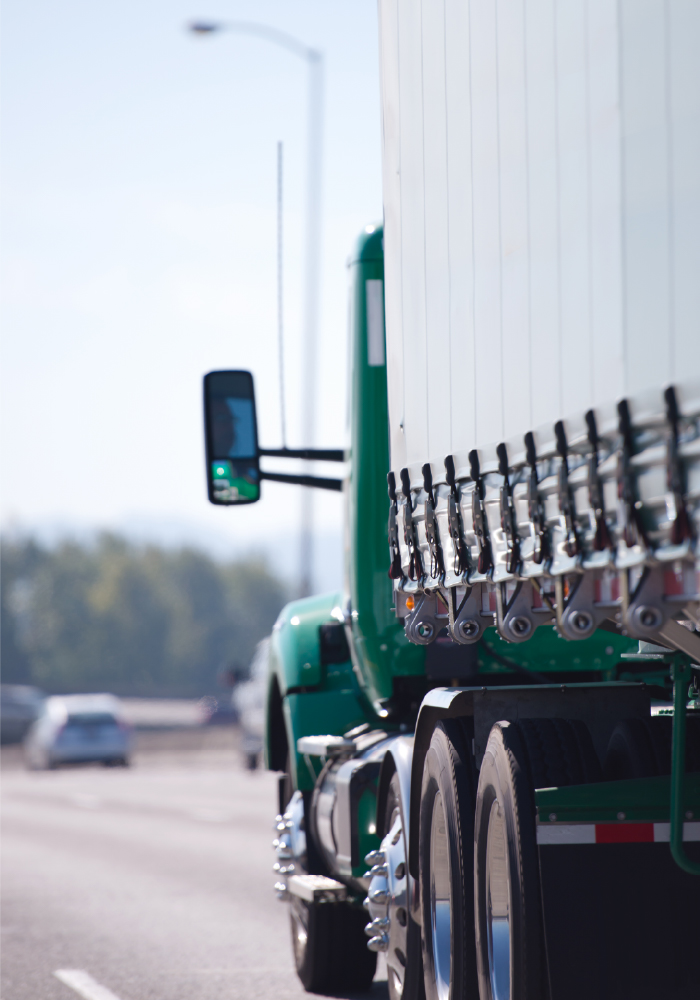
Although agricultural production is generally responsible for the majority of the environmental impact throughout a food product's life cycle, the distances travelled by all the ingredients contained in the product and then by the finished product itself also play a role. The impact of the distances travelled is calculated via the carbon footprint, water consumption and pollution, and land use.
ECO-SCORE® by Beelong takes into account:
- The country of origin of the raw material (place of agricultural production), i.e. of each ingredient in the finished product
- The country of elaboration of the finished product
- The country of consumption
For each product, the distance travelled is recorded via:
- The number of kilometres each ingredient travelled from its place of origin to the place of elaboration (or storage)
- The number of kilometres travelled by the finished product from the place of elaboration to the place of consumption
Water consumption and pollution
Water consumption
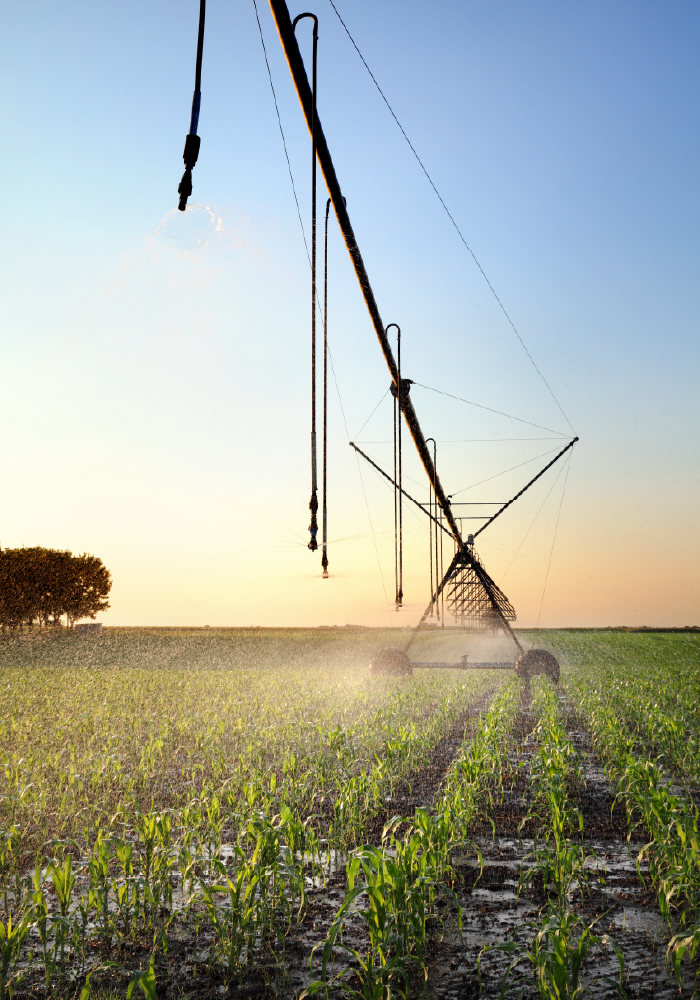
Foods based on animal protein in particular (meat, fish, dairy products, eggs) often require more water for their production. Moreover, not all geographical areas are equal with regard to fresh water resources. Some countries have less water available and therefore higher water stress. The values used for water stress are based on the AWARE method (2018). A food product’s water footprint depends on the water consumption for its production and the water stress caused to country of origin.
The unit used to express the water footprint is the cubic metre [m3]. For ECO-SCORE® by Beelong, the water footprint is expressed in m3/kcal.
Water pollution (fresh and marine)
Water pollution has two main components for which sufficiently robust data is available: freshwater eutrophication and marine eutrophication.
The units for expressing freshwater and marine pollution are phosphorus equivalent [P eq] and nitrate equivalent [N eq] respectively. For ECO-SCORE® by Beelong, this is expressed as P eq/kcal and N eq/kcal.
The calculation of the water consumption and pollution takes into account the agricultural production of each ingredient, the seasonality (cultivation in heated greenhouses), the transport of the ingredients and of the finished product (distances travelled, modes of transport and refrigeration methods used), as well as the packaging of the finished product.
The values used are taken from the World Food LCA Database (Quantis) v 3.5, ecoinvent v 3.8, AGRIBALYSE v 3.0.
Animal welfare
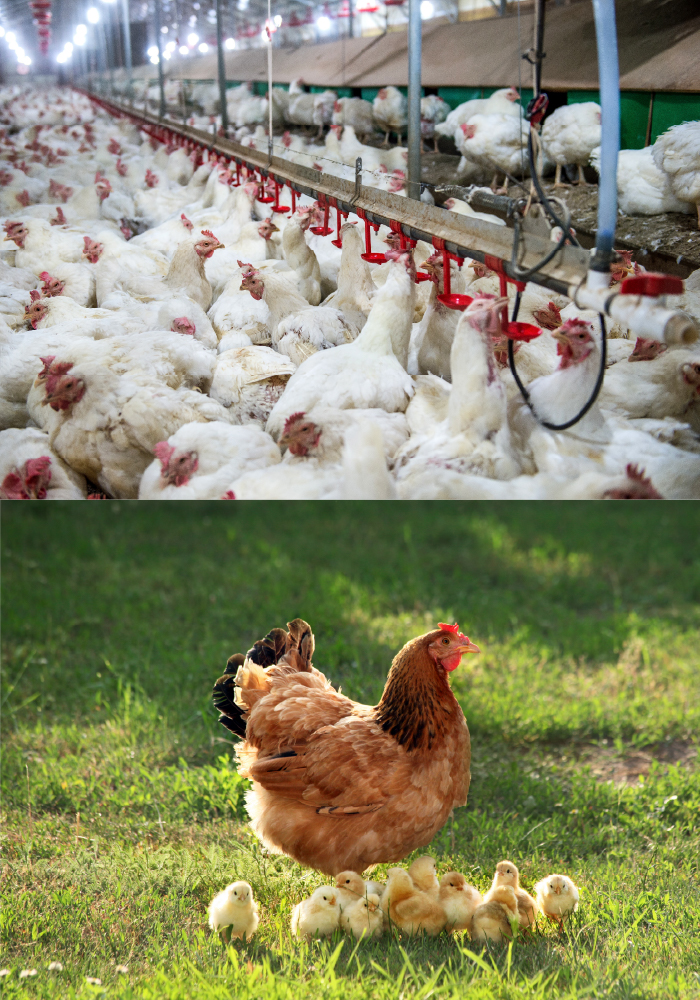
The way in which livestock are reared essentially depends on the mode of agricultural production. For two similar foods, the rearing conditions can vary considerably and have different impact on animal welfare and the environment in general. For instance, free-range and battery-farmed poultry do not experience the same stress, surgery, disease and mortality rates, life expectancy, physical and emotional suffering. Furthermore, the type of feed used by the animals plays a key role in the overall environmental impact of the final product (e.g. soy-based feed versus pasture).
Similarly to the biodiversity assessment, the main challenge in assessing the impact on animal welfare is the difficulty of accessing information on farming conditions. The main sources of information available are also agricultural labels and agricultural legislation of producing countries, as well as some information on specific types of farming (e.g. free range, on the ground) or specific animal husbandry programmes (e.g. SRPA, SST).
Agricultural labels: the number of environmental measures, in particular those aimed at promoting animal welfare, is evaluated. The maximum number of possible measures for Switzerland, for example, corresponds to the Bio Bourgeon (Switzerland), Demeter (Switzerland), or equivalent labels.
Agricultural legislation: the number of environmental measures in the agricultural policies of different producing countries (or geographical areas), in particular those aimed at promoting biodiversity, are identified.
Animal husbandry programmes: the number of environmental measures, in particular those aimed at promoting animal welfare, is evaluated.

Labels
When it comes to food products, biodiversity loss is a concerning issue on par with climate change. Some modes of agricultural production are more eco-responsible than others, and some are better suited to favour biodiversity and its essential ecosystem services.
To assess the impact on biodiversity of a food product, the main challenge is the difficulty of accessing information on its production method. The main sources of information available today are agricultural labels and the agricultural legislation of producing countries.
Agricultural labels: the number of environmental measures, particularly those aimed at promoting biodiversity, is evaluated. More than 100 criteria are currently listed. The labels that include the most environmental measures in their specifications are ranked highest. The ranking of each label may vary according to the product category (plant production, animal production, fisheries, etc.). The maximum possible measures for Switzerland, for example, correspond to the labels Bio Bourgeon (Switzerland), Demeter (Switzerland), or equivalent.
Agricultural legislation
When it comes to food products, biodiversity loss is a concerning issue on par with climate change. Some modes of agricultural production are more eco-responsible than others, and some are better suited to favour biodiversity and its essential ecosystem services.
To assess the impact on biodiversity of a food product, the main challenge is the difficulty of accessing information on its production method. The main sources of information available today are agricultural labels and the agricultural legislation of producing countries.
Agricultural legislations : the number of environmental measures in the agricultural policies of different producing countries (or geographical areas), in particular those aimed at promoting biodiversity, are identified.
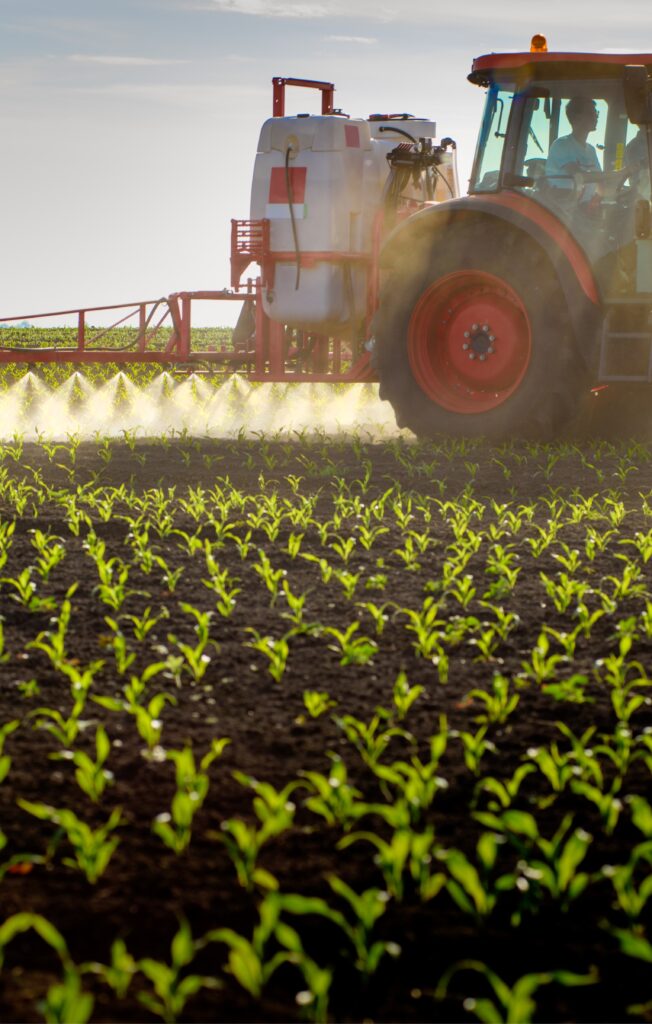
Most countries have an agricultural policy that sets a certain framework within which agricultural production must take place, including for instance, binding or voluntary environmental measures, usually encouraged by financial contributions. For example, Switzerland has developed many environmental measures within its agricultural policy, including the proof of ecological performance (PEP) that Swiss farmers must meet to receive direct payments from the Confederation. Another example is the European Union’s Common Agricultural Policy (CAP), which includes measures that must be respected by all EU member countries.
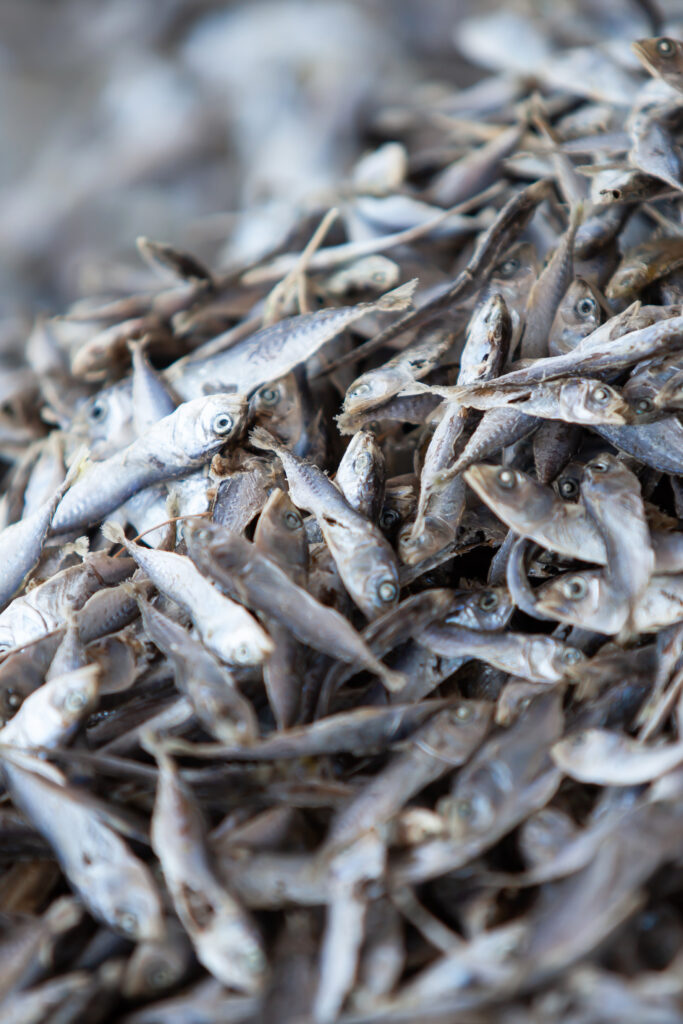
Espèces en danger
Over the past 60 years, fishing has intensified to such an extent that today about one third of the fish stocks are overfished (in the Mediterranean Sea this figure is as high as 93%). This means that the catch rate for these fish is higher than their reproductive capacity. Moreover, as fishing has become highly industrialised, certain fishing techniques (e.g. trawling) destroy marine ecosystems and capture many other species that are not consumed. Our consumption of fish and shellfish therefore has a considerable impact on the state of stocks and on ecosystems.
A “stock” of fish (including shellfish) refers to the population of a certain species of fish living in a specific geographical area. The “stock status” therefore represents the population status of a species in a defined geographical location.
The information used for stock status is based on the assessments proposed by the guide of the World Wide Fund (WWF), Ethic Ocean and the International Union for Conservation of Nature (UICN). Depending on the species, its origin and the fishing technique used, the stock can be assessed as “recommendable”, “acceptable” or “to be avoided at all costs”.
However, traceability remains a major issue for seafood. Information on the exact species (scientific name), the exact origin (FAO fishing area) and the fishing technique used is often difficult to access. Therefore, in case of unknown information, the worst case scenario is always considered.
Ideally, the length of maturity should also be considered, but the lack of information on fish that are often bought already cut up does not yet allow this criterion to be taken into account.
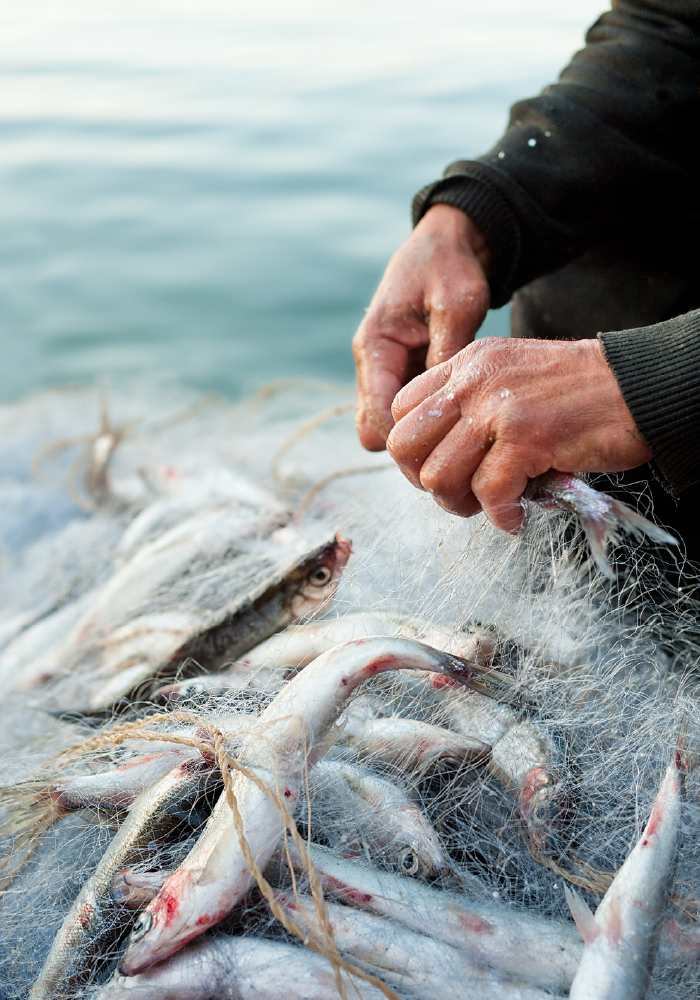
Fishing methods
Over the past 60 years, fishing has intensified to such an extent that today about one third of the fish stocks are overfished (in the Mediterranean Sea this figure is as high as 93%). This means that the catch rate for these fish is higher than their reproductive capacity. Moreover, as fishing has become highly industrialised, certain fishing techniques (e.g. trawling) destroy marine ecosystems and capture many other species that are not consumed. Our consumption of fish and shellfish therefore has a considerable impact on the state of stocks and on ecosystems.
A “stock” of fish (including shellfish) refers to the population of a certain species of fish living in a specific geographical area. The “stock status” therefore represents the population status of a species in a defined geographical location.
The information used for stock status is based on the assessments proposed by the guide of the World Wide Fund (WWF), Ethic Ocean and the International Union for Conservation of Nature (UICN). Depending on the species, its origin and the fishing technique used, the stock can be assessed as “recommendable”, “acceptable” or “to be avoided at all costs”.
However, traceability remains a major issue for seafood. Information on the exact species (scientific name), the exact origin (FAO fishing area) and the fishing technique used is often difficult to access. Therefore, in case of unknown information, the worst case scenario is always considered.
Ideally, the length of maturity should also be considered, but the lack of information on fish that are often bought already cut up does not yet allow this criterion to be taken into account.
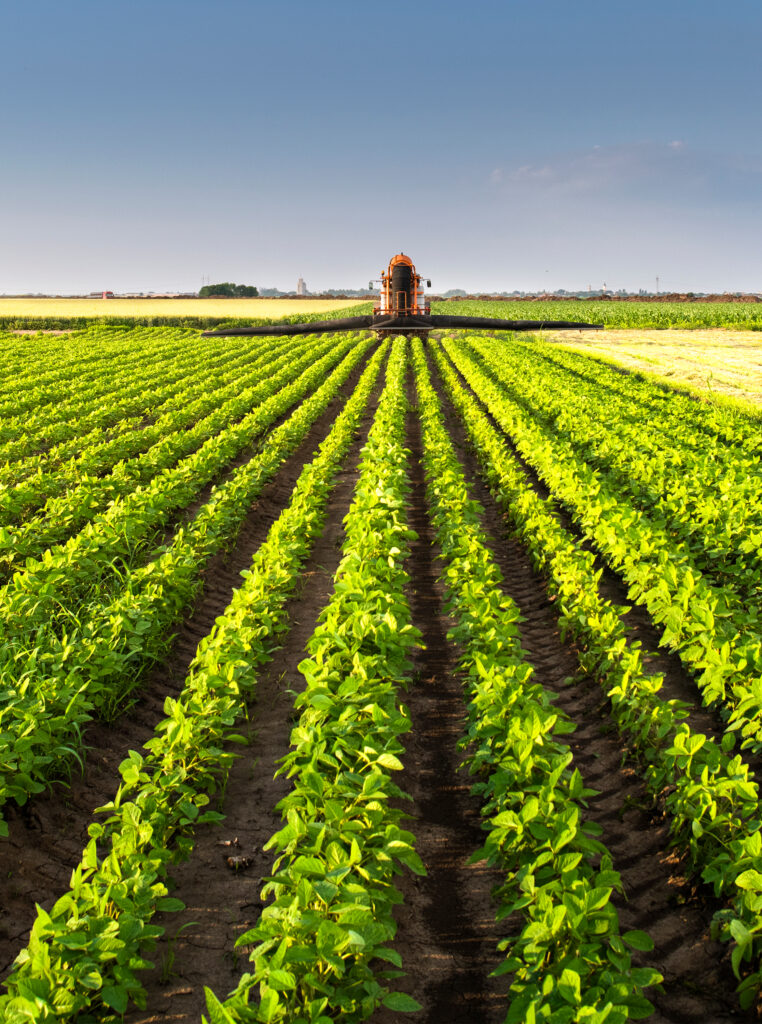
Sustainability policy of producing countries
Food production is closely regulated by the agricultural legislation of the producing countries. The strength of each country’s environmental policies and their impact on the environment is taken into account via the Environmental Performance Index (EPI) created by Yale and Columbia researchers.
It covers 180 countries and aggregates 32 performance indicators into 11 categories: air quality, water quality, heavy metals, waste management, biodiversity and habitat, ecosystem management, fisheries, climate change, pollutant emissions, agriculture, and water resources.
This index is used to evaluate each of the ingredients in the finished product and their origins.
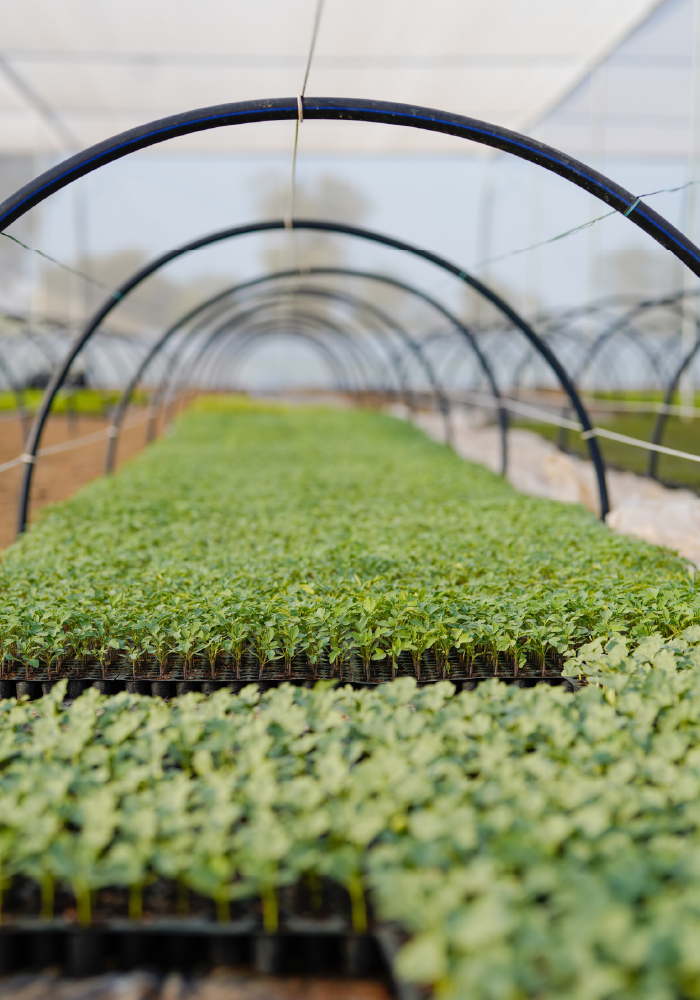
Seasonality of fruit and vegetables
The seasonality of fruit and vegetables indicates, among other things, whether the natural production cycles of the food are respected or whether artificial heating in greenhouses is used. This is mainly to avoid wasting energy that could be used for more necessary purposes, as well as to avoid the pollution generated by fossil fuels.
Therefore, consuming locally does not always mean consuming seasonal products (e.g. eating Swiss tomatoes in February is local but out of season).
The calculation therefore depends on whether the fruit or vegetable is grown in a greenhouse heated with fossil/renewable energy or in an unheated greenhouse. Foods frequently grown in heated greenhouses include: tomatoes, lettuce, peppers, cucumbers, courgettes, aubergines, peppers, strawberries, raspberries, blueberries, etc.
The impact of growing in a heated greenhouse is taken into account in the carbon footprint, water consumption and pollution, and land use calculations.
Frozen or highly processed fruit and vegetables are never considered under the heated greenhouses category (unless otherwise stated) because they are harvested during the peak season before being processed.
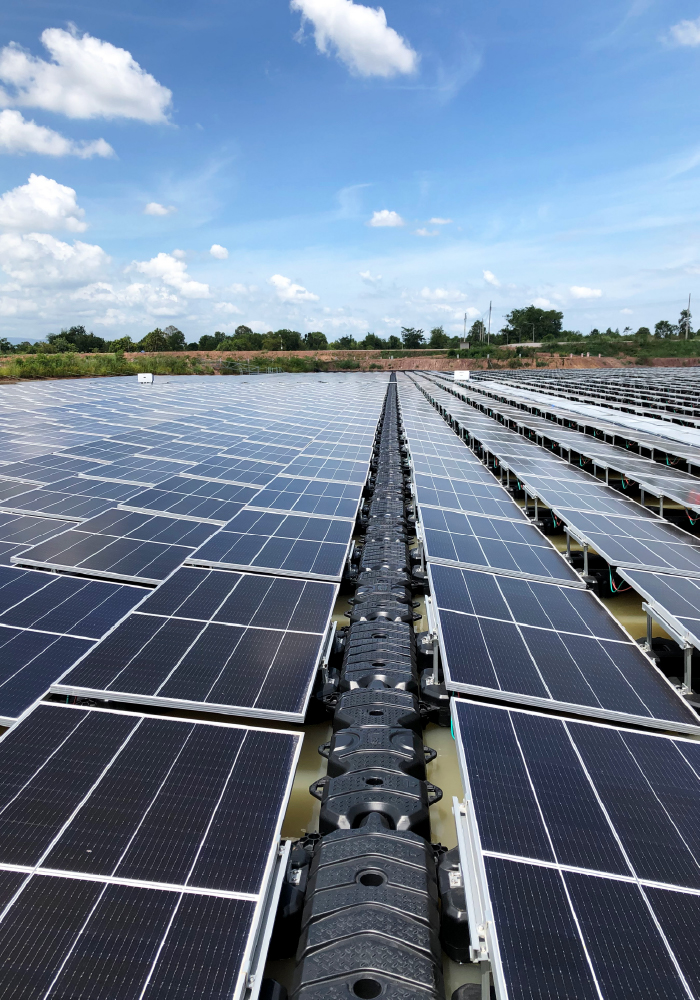
Corporate sustainability policy
A company’s sustainability policy includes measures that are not directly related to agricultural production, but which contribute to reducing the environmental impact at company level. This criterion generally concerns the stakeholder who elaborates the finished product.
These measures include the management of climate change and greenhouse gas emissions, water use and quality, materials and energy use, management/reduction of waste and packaging, possible labels and certifications, monitoring and evaluation of sustainability targets, possible collaboration with third-party sustainability organisations, traceability of raw materials, etc.
The information used is obtained with the help of a 25-question questionnaire, filled in directly by the brands or producers. If the information is not available, the environmental measures taken by the company are not taken into account.
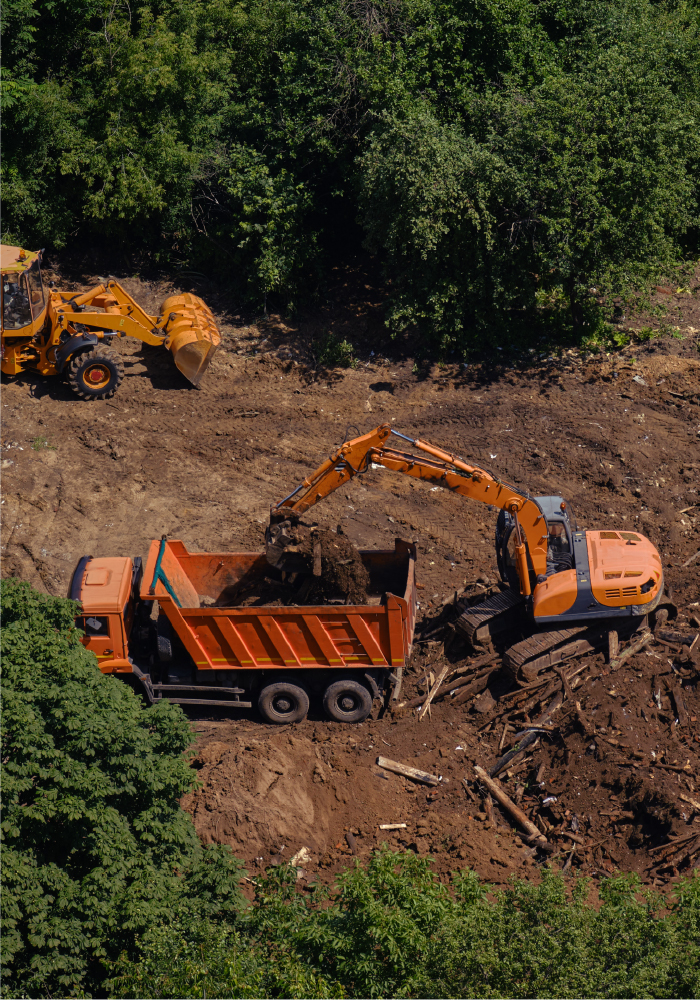
Land use
Soil and its ecosystem are essential natural resources for agriculture. Unfortunately, this valuable resource is currently being degraded on a large scale by disrespectful agricultural practices.
The land use of a food product represents its impact on the soil, i.e. the more pressure a product puts on the soil and its ecosystem (e.g. deforestation, monoculture or intensive cultivation), the higher the impact. Conversely, the less pressure it puts on the soil (e.g. grazing on permanent grassland), the lower its impact.
The calculation for land use takes into account the agricultural production of each ingredient, the seasonality (cultivation in heated greenhouses), the transport (distances travelled, modes of transport and refrigeration methods used), as well as the packaging of the finished product
The values used are taken from the World Food LCA Database (Quantis) v 3.5, ecoinvent v 3.8, AGRIBALYSE v 3.0.
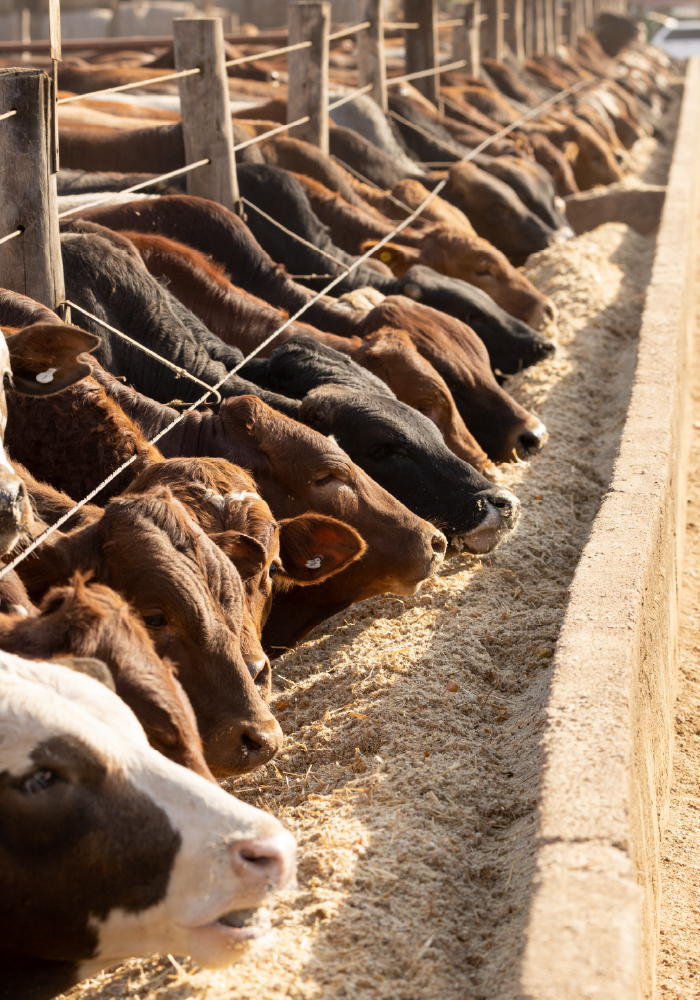
Carbon footprint
Not all the foods we eat have the same impact on the environment. Foods based on animal protein in particular (meat, fish, dairy, eggs) require more resources for their production and therefore have a much greater impact on the environment.
The carbon footprint of a food product is the sum of the greenhouse gases emitted for its production, from the farm to the final stage. The unit used to express the emission of the main greenhouse gases is the equivalent mass of CO2.
The calculation of the carbon footprint takes into account the agricultural production of each ingredient, the seasonality (cultivation in heated greenhouses), the transport of the ingredients and of the finished product (distances travelled, modes of transport and refrigeration methods used), as well as the packaging of the finished product.
The values used are taken from the World Food LCA Database (Quantis) v 3.5, ecoinvent v 3.8, AGRIBALYSE v 3.0.
For some ingredients (such as soy, beef and veal), specific values for Swiss production are used.
Finally, the carbon footprint of the various meat products is calculated according to their edible mass and economic value. Based on the principle that meat production is driven by market demand, price is a relevant indicator of the added value of certain meat cuts compared to others. The underlying idea is that if low cuts were more popular, fewer animals could be reared to satisfy the demand for meat. This allocation approach in the life cycle analysis of meat cuts provides additional leverage for consumers in their diet choices and enhances the value of low cuts. For instance, the carbon footprint of a beef fillet can be up to 5x higher than that of an “average” cut (minced, stewed, boiled, neck, etc.) and up to 20x higher than that of a low cut (liver, tongue, tripe, etc.).
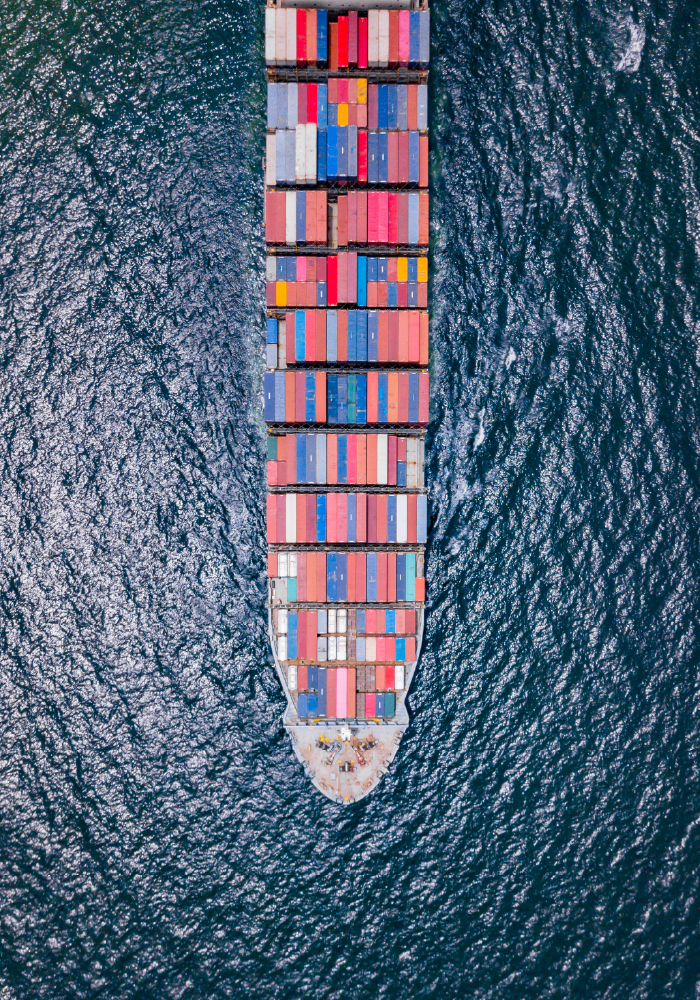
Modes of transport
Although agricultural production is generally responsible for the majority of the environmental impact throughout a food product’s life cycle, transport can also be a significant factor if it is carried out by air. It is estimated that energy consumption is thirty times higher for food transport by air than by truck (CEC, 2017).
For each of the distances travelled by the ingredients and the finished product, the impact of the modes of transport is calculated via the carbon footprint, water consumption and pollution, and land use.
Several modes of transport (truck, train, boat, plane, car, electric car, bicycle, etc.) can be used for the same journey. For instance: truck and boat for bananas from South America.
The information used is provided by the brands, distributors or producers. Where information is not available, assumptions are made according to the product’s type, origin and packaging.
Methods of preservation
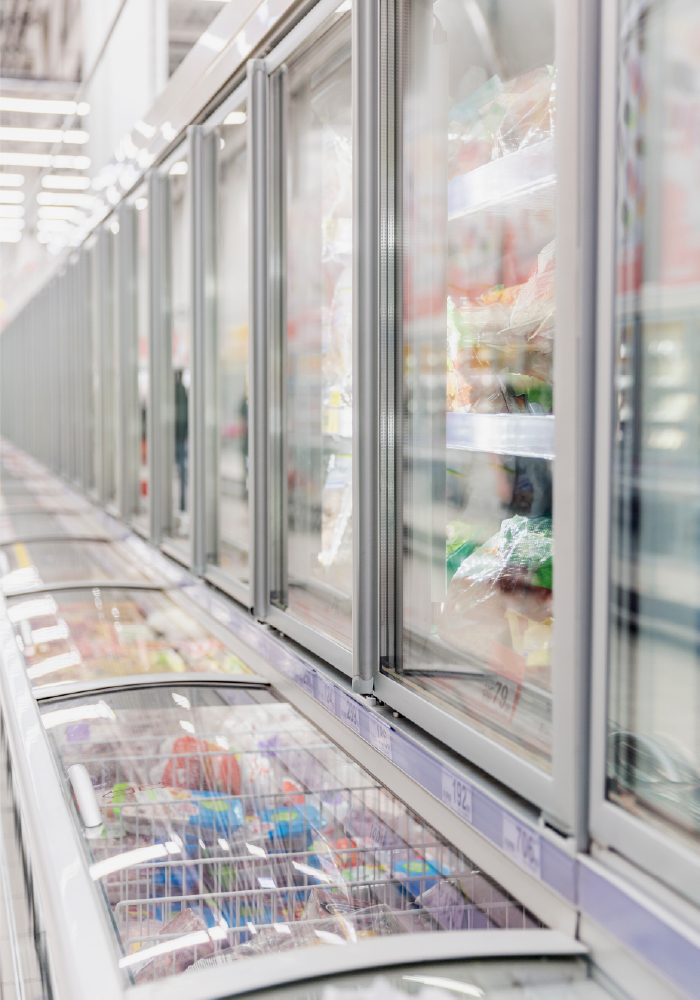
Existing methods of preservation include the use of cold, such as refrigeration and deep-freezing. These methods have an impact on the energy consumption of a product.
The impact of the methods of preservation (non-refrigerated, refrigerated, frozen) is calculated via the carbon footprint, water consumption and pollution, and land use.
The information used is provided by the brands, distributors or producers. Where information is not available, assumptions are made according to the product’s type, origin and packaging.
Packaging
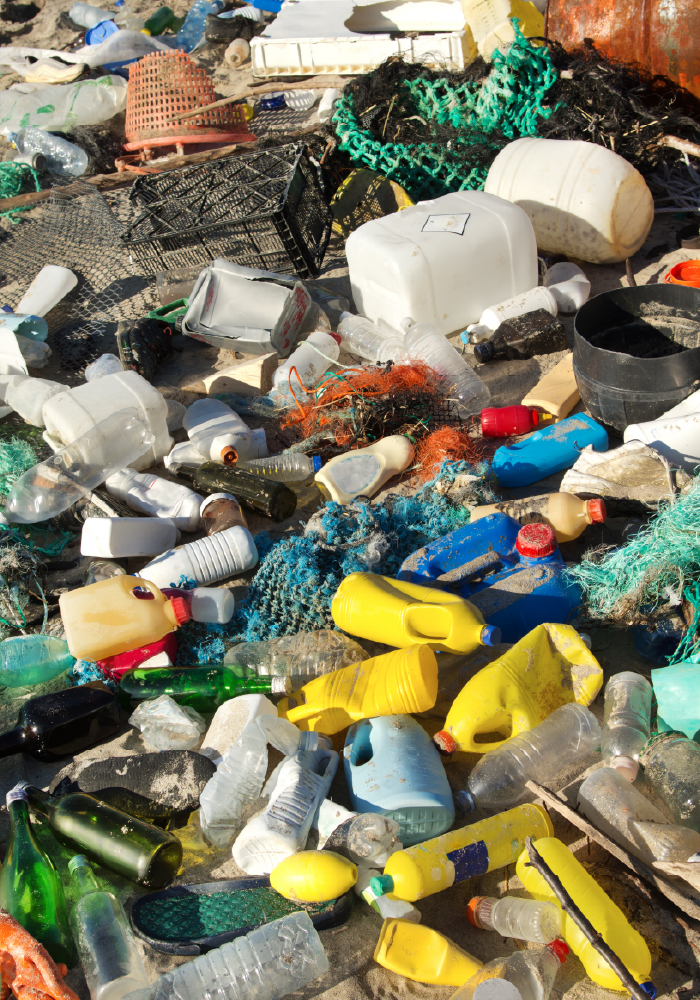
The environmental impact of each packaging depends on the amount of material needed to package the product, the environmental impacts generated by the production of the raw materials, and their recyclability.
For the same food product, different pieces of packaging can be considered, e.g. for a yoghurt: the plastic pot, the aluminium lid and the paper label surrounding the pot.
The durability of the packaging depends on the material used and the overall weight (size):
Material: the impact per kg of packaging varies depending on whether it is made of paper, glass, aluminium, PET, plastics, cloth, etc.
Size: the impact per kg of packaging also varies depending on the quantity of packaging, e.g. for a punnet, a small or large bag, a small or large bottle, a wrapping film, a brick, etc.
The environmental impact of packaging is calculated:
- via the carbon footprint, water consumption and pollution, and land use
- based on the nature of the upstream material: incorporation rate of recycled material, share of renewable and sustainable / renewable and non-sustainable / non-renewable raw material
- based on the nature of the downstream material: the share of recyclable, biodegradable, landfillable/incinerable material
Let's chat!

